
Using Neurolucida for Dendritic Spine Analysis
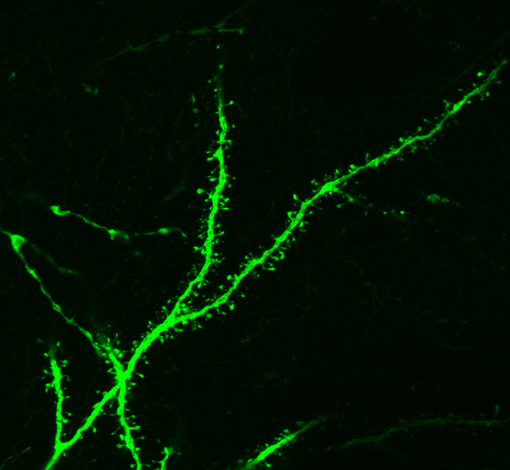
Neurolucida is used for reconstruction and morphometric analysis of neurons and anatomical regions of interest. Neurolucida can also be used for quantitative and qualitative analysis of dendritic spines. Spines are small, often bulbous protrusions that emerge from the dendritic shaft. They are the main site of excitatory synapses in the brain [1], and they range in length from 0.001 to 1mm and range in diameter from 0.5 to 2mms [2, 3]. Alterations in spine number and shape have been implicated in learning and memory, long-term potentiation, and synaptic efficacy [1-3]. Abnormalities in dendritic spine number and shape have been observed in pathological conditions such as Alzheimer’s disease, Parkinson’s disease, epilepsy, and trauma [2, 3]. The aging brain also exhibits a decrease in dendritic spines on cortical pyramidal neurons, leading to a decline in cognitive function, learning, and memory [2].
In Neurolucida there are currently two methods used to trace spines for quantitative analysis. The first method involves tracing spines as the neuron is reconstructed either directly from a tissue slide using a microscope and motorized stage or from an image stack. If spines are traced on an image stack, the 3D rendering of the image stack plus the tracing can be viewed using the 3D Solid Modeling module. This rendering allows the user to validate the placement of spines and the neuronal processes. In the other method, spines can be added after the entire neuron has been reconstructed using Neurolucida editing tools. Once the neuronal reconstruction is complete, morphometric analysis of the neuronal processes and dendritic spines is done in Neurolucida Explorer.
Neurolucida Explorer offers a number of quantitative spine measurements under Branched Structure Analysis. The first analysis is ‘neuron summary’, which lists the total number of spines placed. The second is ‘segment-dendrite analysis’ which lists the number of spines per tree or segment. This number can then be used to calculate spine density per tree. The next analysis, ‘spine report’, lists the spine number and density per branch order. The final analysis, ‘spine details,’ lists the spine length (distance from spine base to tip), area, volume (assumes the spine is cylindrical), distance of the spine from the origin of the neuronal process, and the X,Y,Z coordinates at the base of the spine.
Version 9.0 of Neurolucida improves on the previous versions’ process of classifying spine morphology. Before, the user manually marked the spines with markers named for each spine type, and marker totals indicated the number of each type of spine indentified in the trace. In the new version, users have the ability to efficiently classify spines according to five classes: thin, stubby, mushroom, branched, and filopodia. The quantitative spine analyses that are available have expanded to include spine morphology, and spine detection, tracing, and editing are more effective and user-friendly.
1. Zito, K. and V.N. Murthy, Dendritic spines. Curr Biol, 2002. 12(1): p. R5.
2. Calabrese, B., M.S. Wilson, and S. Halpain, Development and regulation of dendritic spine synapses. Physiology (Bethesda), 2006. 21: p. 38-47.
3. Lee, K.J., et al., Morphological changes in dendritic spines of Purkinje cells associated with motor learning. Neurobiol Learn Mem, 2007. 88(4): p. 445-50.
Julie Simpson is a staff scientist at MBF Bioscience.
{Confocal image of dendritic spines featured above, courtesy of Jakub Jedynak}
First published in The Scope, fall 2008.