
Blue Brain scientists develop pyramidal cell classification system using neurons reconstructed with Neurolucida 360
After decades of identifying brain cells subjectively, researchers can now make use of a standardized classification system for identifying pyramidal cells—the most common type of cells in the neocortex. Scientists at the Blue Brain Project developed the system using mathematics that identify the properties of shapes that stay constant under continuous transformation. This new method of classification gives researchers the ability to begin building a catalog of all the different cells in the brain.
The field of applied mathematics known as “topological data analysis” uses topological methods to uncover patterns in large, high-dimensional datasets that might otherwise go unnoticed. In a collaborative effort led by the Blue Brain Project, directed by Dr. Henry Markram, researchers used topological data analysis to develop an objective method of classifying pyramidal cells based on their morphology.
The morphology and behavior of neurons can vary widely, and developing methods for classifying and differentiating between different types of cells has proven advantageous for scientific research. However, investigators tend to devise their own methods, which often results in contradictory classifications of the same tissue between researchers, and even repeat trials of the same tissue with the same investigator can produce contradictory results (DeFelipe et al, 2013). To avoid investigator biases, the Blue Brain scientists used the Topological Morphology Descriptor (TMD) algorithm to analyze pyramidal cells reconstructed with Neurolucida 360. The aim of the TMD algorithm is to produce a simplified representation of the cell morphology based on the topological descriptors of the cell’s shape rather than visual inspection and feature selection (Kanari et al, 2018). Using the algorithm, they made the same differentiations between cell types that experts had made previously, but they also observed two types of pyramidal cells typically identified by experts, which were not able to be differentiated by the topological data available, suggesting that these cell types either represent opposite ends of a continuum of expression, or that experts are noticing topological features that were not captured by this version of the algorithm.
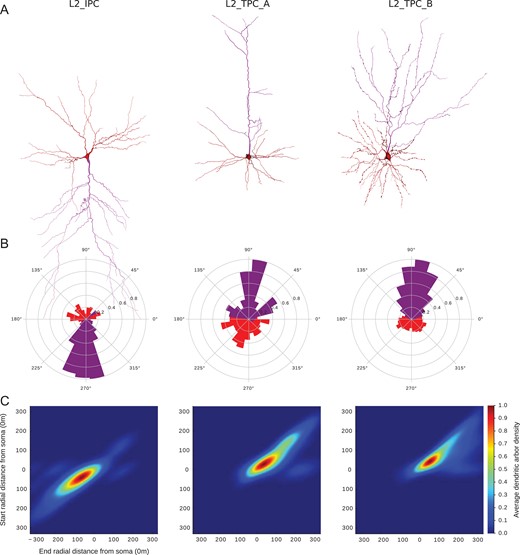
Three PC types/subtypes in Layer 2. (A) Exemplar reconstructed morphologies of PC dendrites: the apical dendrite is presented in purple and the basal dendrites in red. (B) Polar plot analysis of dendritic branches (apical in purple, basal in red). Tufted PCs are oriented towards the pia and the inverted PCs in the opposite direction as they project towards the white matter. (C) The Topological Morphology Descriptor (TMD) of apical dendrites characterizes the spatial distribution of branches with respect to the radial distance from the neuronal soma. The average persistence images (per type of PC) illustrate the average dendritic arbor density around the soma.
This study represents an important step towards objective classification of cells, and there is broad potential for expanding on this work. One challenge the authors discuss is the volume of data available for developing and validating a TMD algorithm—some cell types simply haven’t been observed and digitally reconstructed as often as the pyramidal cells studied here. However, the analytical potential of the TMD lies in its broad applicability. Since it operates on 3D tree-like structures, any neuron digitally reconstructed in 3D can in theory be analyzed by the TMD algorithm. The authors leave us with an open invitation to work with and expand the TMD algorithm.
In a very recent publication (Gillespie et al, 2022) researchers have noted that the US Brain Initiative Cell Census Network, Human Cell Atlas, Blue Brain Project, and others are generating vast amounts of data and characterizing large numbers of neurons throughout the nervous system. They have proposed Neuron Phenotype Ontology: A FAIR Approach to Proposing and Classifying Neuronal Types.
At MBF Bioscience we’re also working to establish consensus within the neuroscience community, and have published a full specification of our neuromorphological file format used to store these 3D digital reconstructions. We invite the global community to make use of this format for storing their own digital reconstructions.
And if you’re interested in learning more about obtaining detailed reconstructions of cells in your samples with Neurolucida 360, request a free demonstration of Neurolucida 360 from our team of experts.
References:
DeFelipe, J., López-Cruz, P., Benavides-Piccione, R. et al. New insights into the classification and nomenclature of cortical GABAergic interneurons. Nat Rev Neurosci 14, 202–216 (2013). https://doi.org/10.1038/nrn3444
Gillespie, T.H., Tripathy, S.J., Sy, M.F. et al. The Neuron Phenotype Ontology: A FAIR Approach to Proposing and Classifying Neuronal Types. Neuroinform (2022). https://doi.org/10.1007/s12021-022-09566-7
Kanari, L., Dłotko, P., Scolamiero, M. et al. A Topological Representation of Branching Neuronal Morphologies. Neuroinform 16, 3–13 (2018). https://doi.org/10.1007/s12021-017-9341-1
Lida Kanari, Srikanth Ramaswamy, Ying Shi, Sebastien Morand, Julie Meystre, Rodrigo Perin, Marwan Abdellah, Yun Wang, Kathryn Hess, Henry Markram, Objective Morphological Classification of Neocortical Pyramidal Cells, Cerebral Cortex, Volume 29, Issue 4, April 2019, Pages 1719–1735, https://doi.org/10.1093/cercor/bhy339