Edit Trees Panel (3D)
See Editing trees (3D) for detailed instructions.
Purpose

|
Use the Edit Trees panel in the 3D Environment to change trees that have already been modeled. |
To view more options in the panel, select trees first (click the Select All button or click on a tree that has been drawn).
In multi-color-channel images, if trees are associated with a single color-channel (that is, if a color channel was selected prior to tracing or detecting the trees), select that color channel (using the Channel panel or the Image Adjustment tool) to access all of the tree-editing functions.
Tools and controls in the Edit Trees panel
Selection and Show/Hide Controls
-
Select by Type: Choose a tree type from the drop-down menu to select all trees of that type.
-
Select All: Click to select all the traced trees.
Alternatively you can select one or several vessels with the mouse:
-
To select a single vessel, click the vessel.
-
To select several adjacent vessels, press the CTRL key and draw a marquee (rectangle) around the vessels of interest.
-
-
Hide/Show Selection controls
-
Select a tree and click the Hide selection button to hide it.
-
You can show the tree if it is still selected by clicking the Show selection button
-
Click the Show all hidden button to "unhide" all trees that are hidden.
-
Tree-editing tools
-
 Points: Click to view the trees displayed as a series of points (Points mode). Click again to exit Points mode.
-
Points mode enables Detach at a specific point, Connect and Directionality.
-
You can move and delete points, and adjust a point's thickness.
-
-
 Detach: Click to enable/exit Detach mode.
 If you also click Points, you'll be able to detach with more precision.
-
Click a tree to detach.
-
If you click on a single branch, the tree is split in two.
- If you click the site of a bifurcation, the tree is split in three.
-
- Exit Detach mode by clicking the Detach button again
-
-
 Connect: Click to enable/exit Connect mode.
 Trees will be displayed as a series of points in Connect mode.
-
Click and drag an end point toward the desired connection point. The end point briefly turns green and a green line appears when a connection can be made. Release the mouse button to connect the branches.
-
-
 Cleanup
(Available only with the Neurolucida 360 Studio or Utra package)
 Click to learn more.
After tracing complex structures with the user-guided or automatic tracing mode, there may be tree fragments. Cleanup identifies these issues and helps you resolve them quickly.
Types of issues:
- Branch fragment found: Single-point branches attached to trees; Fix will detach those branches and then delete them.
- Tree fragment found: Two-point trees not attached to anything: Fix will delete these trees.
- Root fragment found: Two-point roots with bifurcating nodes; Fix will re-assign the origin to the node at the bifurcation and delete the fragment below the bifurcation.
- Fragment found: Single-branch trees (i.e., with at least three points) not connected to anything; edit manually to fix this issue.
Solutions (Fix column):
 The fragment can be deleted automatically.
 Manual editing is recommended (e.g., merging).
 Indicates automatic reassignment of the origin to the node at the bifurcation and deletion of the fragment below the bifurcation.
- To delete all fragments marked in the list, click Clean All.
- To inspect a specific issue, click it in the list, the corresponding area in the tracing will be zoomed in and highlighted.
- To resolve a specific issue, click in the Fix column.
-
 Classify: Click to enable classification of tree segments for later analysis in Neurolucida Explorer software.
 -
Click to select a tree segment or select several segments by holding the Ctrl key and clicking the segments of interest.
-
Select a name from the drop-down menu.
-
To customize the names in the list, click Color Sets, highlight a name and type a new name.
-
Select the tree segment(s) you want to classify.
-
Find the classification for the selected segment(s) by scrolling or searching the anatomical terminology list.
To search the list, start typing into the Search Terms box.
-
Click the classification to apply it to the selected segment(s).
-
 Click Remove to delete selected trees/branches.
Alternatively, click the Delete key on your keyboard to delete selected trees/branches.
If applicable, see separate instructions for SPARC users below.
Note: Classification color changes will not be visible in 2D software window.
SPARC users will see a slightly different interface that displays anatomic terms associated with the subject information entered when Neurolucida 360 software was launched. To classify tree segments in SPARC mode, do the following:
Appearance and data controls
-
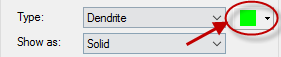
Type: Select a type from the Type: drop-down menu to assign it to selected trees.
Note: Changing the tree type does affect the data associated with the image. This may be useful for analysis of your data in Neurolucida Explorer software.
-
Color Picker:The color picker to the right of the Type menu can be used to change the color used to represent spines. To change the color of selected trees, click the arrow near the colored square and choose a color from the color picker.
-
Show as: Use the drop-down menu to choose how selected trees are displayed.
-
Channel: In images with more than one color channel, use the drop-down menu to associate the selected trees with a specific color channel.
Changing a tree color-channel does affect the data associated with the image.
-
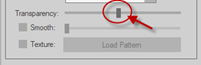
Transparency: Drag the Transparency slider to increase the transparency of selected trees.
(You may want to hide trees instead.)
-
Smooth: Check the box and drag the slider to smooth the appearance of selected trees (they will appear less jagged).
This feature is for visualization purposes only (e.g., snapshots for publications); it does not affect your data.
-
Surface: Use the drop-down menu to choose a surface effect. (This feature is for visualization purposes only, e.g., snapshots for publications; it doesn't affect your data.)
 Click to access additional surface specific controls including gradient colors, transparency, and other context dependent settings.
-
Tree Color: Displays trees as the color they were originally traced as, or as the color chosen from the Color Picker.
-
Branch Order: Colors trees according to their branch order.
-
Class: Displays trees in classification colors if branch segments have been classified.
-
Diameter: Displays the diameter (µm) of the branch as a color gradient.
-
Distance to Markers: Displays distance (µm) between trees and markers as a color gradient. Must have a marker present.
-
Distance to Puncta : Displays distance (µm) between trees and puncta as a color gradient. Must have a punctum present.
-
Distance to Spines: Displays distance (µm) between trees and spines as a color gradient. Must have a spine present.
-
Distance to Varicosities: Displays distance (µm) between trees and varicosities as a color gradient. Must have a varicosity present.
-
Texture: Select an image with the texture you want to apply to the surface of selected trees from the Load Texture Image window that opens.The image must be one of the following formats: .png, .tif, .jpg, or .bmp.
-
-
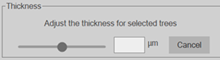
Thickness: You can change the thickness of an entire tree or the thickness at a single point (or a group of points).
Changing the thickness of a tree or portion of a tree does affect the data associated with the image.
-
Click a tree to select it or click the Points button and select the points you want to adjust. Drag the slider or type a value in µm for the thickness you want.
-
-
(SPARC users) Reduce Points: Use the slider to reduce the number of points in selected trees. This can make it easier to edit trees. Note that the data file is saved with the suffix "_Reduced" so that the original data file is not overwritten.