Analysis
Purpose

|
Analysis calculates and displays quantitative information about the traced structures in your images. The analyses are grouped according to structure type (described below). The display for each analysis is tailored to the data type and results. |
Procedure
-
 Click Analysis to open the Analysis Viewer window.
 -
Choose an analysis from the list on the left side of the Analysis Viewer window.
-
Review content sensitive parameters and adjust as needed:
- Data Range: Select the start and end time points for your analyses using the pull downs, then click apply.
- Threshold: The threshold is the percent variation in spine size between time points that the software uses to register change. If the change in size does not exceed the percent threshold, the spine will be not be included in the Growth or Shrinkage categories in the Change Ratio analysis. You may want to adjust the default threshold value for your analysis.
Note that the names of time points can be customized using Configure Display in the Image selection panel.
The following tools are available for all analyses:
Copy to Clipboard: Click to copy the graph currently displayed in the Analysis Viewer window to your clipboard so that you can paste it into another software program.
Export to Excel: Click to export data to Microsoft Excel. MicroDynamix software will open an Excel spreadsheet with the results table(s) from the Analysis Viewer.
-
Export current analysis: Choose this option to export the data currently displayed in the Analysis Viewer window.
-
Export all analyses: Choose this option to export all possible analyses in the specified Data Range.
You can customize options for measurement units and numerical precision in the Numerical formatting preferences panel.
Dendrite Analyses
The total length of each dendrite is displayed at each time point. Dendrites that are associated across time points are shown in the same row of the data-display table, with total length at each time point shown in columns. In the lower window, a line graph shows minimum, average, and maximum dendrite length at each time point.
Calculated as the quantity of spines on the dendrite divided by the dendrite length.
The spine density of each dendrite is shown at each time point. Dendrites that are associated across time points are shown in the same row of the data-display table, with spine density shown in columns. In the lower window, a line graph shows minimum, average, and maximum spine density values at each time point.
Marker Analysis
The marker change ratio provides a summary of changes across all time points in the specified Data Range. The data are summarized in a bar graph in the lower window.
- Existing: Number of identified markers present in the starting time point.
- New: Number of markers present that are not associated with markers in the previous time-point.
- Lost: Number of markers that are no longer present relative to the previous time-point.
- Reappear: Number of markers that are present after being lost in a previous time point.
Spine Analyses
The spine change ratio provides a summary of changes across all time points in the specified Data Range. The data are summarized in a bar graph in the lower window.
- Existing: Number of identified spines present in the starting time point.
- New: Number of spines present that are not associated with spines in the previous time-point.
- Stable: Number of spines that did not grow or shrink beyond the threshold value relative to the previous time-point. Note that the calculation is not performed if the spine was not present in the previous time point.
- Growth: Number of spines exhibiting percent growth above the threshold value relative to the previous time-point.
- Shrinkage: Number of spines exhibiting percent shrinkage above the threshold value relative to the previous time-point.
- Lost: Number of spines that are no longer present relative to the previous time-point.
- Reappear: Number of spines that are present after being lost in a previous time point.
Threshold: The threshold is the percent variation in spine size between time points that the software uses to register change. You may want to adjust the default threshold value for the Change Ratio analysis.
A spine is counted only once for each category. For example, if a spine grows and shrinks, then grows and shrinks again, that spine is counted once only in the Growth and Shrinkage categories.
If spines have been classified, this analysis displays the number of spines in each class (e.g., thin, stubby, mushroom, etc.) at each time point in the specified Data Range. The data are summarized in a bar graph in the lower window.
Spines detected with the option Use Simple Spine Model selected are not classified by spine type. They can be manually classified using the Edit Spines Panel. To use MicroDynamix automatic spine classification function, deselect the option Use Simple Spine Model before detecting spines, then click Classify All (see Detecting and classifying spines).
If spines have been classified, this analysis displays each spine and its class at each time point in the specified Data Range. Spines that are associated across time points are shown in the same row of the data-display table, with spine classifications shown in columns. In the lower window, the number of spines whose classification type changed from the previous time point are displayed in a line graph.
Spine count provides the total number of spines at each time point in the specified Data Range. The data are summarized in a bar graph in the lower window
Spine-head diameters are based on Rayburst diameters calculated in the XY plane after the automatic spine-detection process.
The head diameter of each spine is displayed at the time points in the specified Data Range. Spines that are associated across time points are shown in the same row of the data-display table, with head diameters shown in columns. In the lower window, a line graph shows minimum, average, and maximum head diameters at each time point.
Reports the average intensity of all pixels located on the same plane as the spine head and within a head radius from the spine head center.
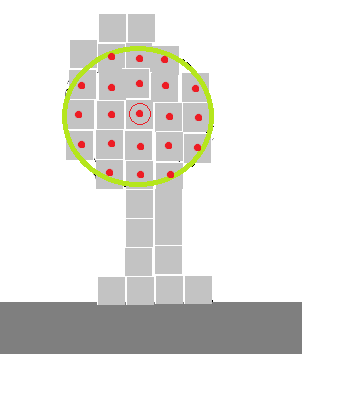
Luminance for each spine head at each time point is displayed in a table, with spines associated across time points on the same rows. In the lower window, a line graph shows minimum, average, and maximum spine-head luminance at each time point.
Plane angle refers to the radius of the spine attachment vector with respect to the optical plane.
- Zero means that the spine axis is parallel to the optical plane.
- 90 (+/-) means that the axis is perpendicular to the optical plane.
Plane angles can be useful for discriminating between spines that are clearly visible on the side of the dendrite and spines that are detected over or under the dendritic segment when viewed in the direction of the optical axis.
Plane angles for each spine are displayed at each time point in the specified Data Range. Spines that are associated across time points are shown in the same row of the data-display table, with plane angles shown in columns. In the lower window, a line graph shows minimum, average, and maximum plane angles at each time point.
This analysis displays the (X,Y,Z) coordinate position of each spine at each time point in the specified Data Range. Spines that are associated across time points are shown in the same row of the data-display table, with spine positions shown in columns.
The total extent or spine length is the shortest distance from the most distal voxel identified to the surface of the dendrite. 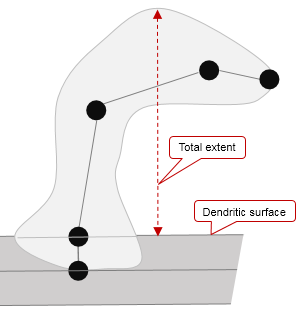
The total extent of each spine is displayed at each time point in the specified Data Range. Spines that are associated across time points are shown in the same row of the data-display table, with total extent shown in columns. In the lower window, a line graph shows minimum, average, and maximum spine length at each time point.