Segments
Purpose

|
Vessel Segments analysis provides access to multiple analyses pertaining to vessel segments. A segment is defined as any portion of a branched structure with endings that are either nodes or terminations with no intermediate nodes. |
Analysis results
Segment Details
Quantitative data for individual segments are reported:
Network: The network that includes the segment point.
Classification: The classification of the segment. If no classification was assigned, the cell is empty.
Segment ID: The segment that includes the point.
Segment length (µm): Total length of the path used to trace the segment.
Avg diameter (µm): Length-weighted mean diameter for each segment. The segment is modeled as a series of frusta. The length of each frustum is used in the calculations to provide a correct average diameter over the length of the segment as it tapers.
Tortuosity: Tortuosity = [Actual length of the segment] / [Distance between the endpoints of the segment]
- The smallest possible tortuosity value is 1. This indicates a straight path.
- Tortuosity increases as the segment assumes a more complex path to reach its destination.
- Tortuosity allows segments of different lengths to be compared in terms of the complexity of the paths they take.
Segment Points
Quantitative data about segment points are reported:
Network: The network that includes the segment point.
Classification: The classification of the segment. If no classification was assigned, the cell is empty.
Segment: The segment that includes the point.
Start X: The X coordinate of the start point of the segment.
Start Y: The Y coordinate of the start point of the segment.
Start Z: The Z coordinate of the start point of the segment.
End X: The X coordinate of the end point of the segment.
End Y: The Y coordinate of the end point of the segment.
End Z: The Z coordinate of the end point of the segment.
Length (µm): The distance between the point and the previous point (towards origin) on the segment.
Start diameter (µm): The diameter of the segment at its starting point.
End diameter (µm): The diameter of the segment at its ending point.
Avg diameter (µm): The average diameter of the segment.
Surface area (µm²): The total surface area of the segment.
Volume (µm³): The total volume of the segment.
Segment Angle
Quantitative data about segment angles are reported:
 Planar Angle (°)
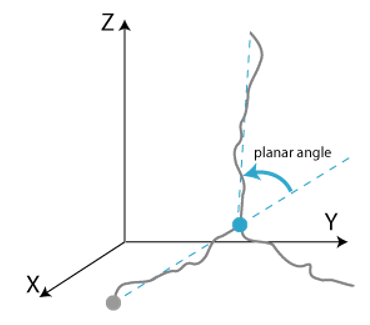 Basic angular value.
The local information about the segments is disregarded and the segments are seen as lines that connect the endpoints.
The endpoints are the origin of the vessel, the nodes of the vessel, and the terminations.
This simplification of the vessel emphasizes the overall structure of the vessel.
The angle is the change in direction from one segment to the next segment.
- Example: For a straight line with a node in the middle of the line, the planar angle is 0 -- not the 180º angle measured by placing a protractor at the node.
Local Angle (°)
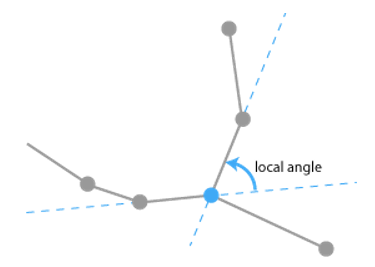 Change in direction using the line segments closest to the node.
Measured with the same method as the planar angle.
Change in direction using the line segments closest to the node.
Measured with the same method as the planar angle.
The local angle disregards the overall structure of the vessel and concentrates on the information at the nodes. T
The local angle measurements can be prone to problems due to local errors. Part of the problem is due to the manner in which digital devices work. Coordinates are laid out in a checkerboard pattern. A point has only 8 neighbors, therefore, only 8 possible angles are available. The next ring of neighbors adds only 8 new possible angles. This means that, if the tracing is done with great care, the local angles are restricted to approximately 22 degree intervals. The planar angle does not have this problem since the endpoints are spaced far enough apart that the discrete nature of the measurement tools is not noticeable.
Local Spline Angle (°)
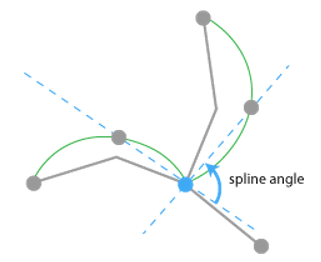 Alternate method to avoid the problems that
can affect the local angle.
Alternate method to avoid the problems that
can affect the local angle.
Since the simplest curves that can be traced through 3D space are cubic curves, the branches are replaced with cubic splines. The splines smooth the segments. Tangents are taken at the ends of the cubic splines. The change in direction in the tangents is reported as the local spline angle.
Contiguous Segments
Quantitative data for each contiguous length of segments is reported:
Length (µm): Total length of the paths used to trace the contiguous segments.
Avg diameter (µm): Length-weighted mean diameter for each contiguous length of segments. Segments are modeled as a series of frusta. The length of each frustum is used in the calculations to provide a correct average diameter over the length of a segment as it tapers.
Binned Segments
Segments are grouped in bins according to their average diameters and quantitative data for each bin are reported:
Segment details by diameter: The maximum diameter for each bin is incremented by this value.
For example, if you enter 5 μm, segments will be analyzed as follows:
-
0 < diameter ≤ 5
-
5 < diameter ≤10
-
10 < diameter ≤ 15, etc.
Length (µm): Total length of the paths used to trace the segments.
Surface area (µm²)/volume (µm³): Computed by modeling the pieces of the segments as frusta (i.e., truncated right circular cones).
Avg diameter (µm): Length-weighted mean diameter for all segments in each bin. Segments are modeled as a series of frusta. The length of each frustum is used in the calculations to provide a correct average diameter over the length of a segment as it tapers.
Segment count: Number of segments per bin.
Point count: