Using the Fractionator to build a heat map
Fractionator can be used for population estimates or object distribution within a single-layer region of interest (ROI).
Example: Creating a topographic map of retinal ganglion cells within the retina.
While in traditional stereology you may choose parameters (counting frame and grid size) appropriate for counting "enough" cells, topographic work generally requires a greater sample and a different parametrization. Here are some guidelines:
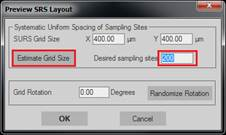
- Decreasing the grid size (more distance between sites) increases the resolution of your topographic map. A good starting point is to use Preview SRS layout to define an SRS grid size that provides approximately 200 sites per retina [cf. article by Cohn, Collin et al.), but you may need more or fewer sites depending on the nature of your project.
- Increasing the counting frame size (more cells marked per site) increases the precision of your topographic map. A good starting point may be a counting frame that contains approximately 5 cells (on average), but you may want to adjust this.
- The coefficient of error (usually Scheaffer method for Fractionator work) can be used to get an idea of how your cells are distributed. In general, ROIs with more homogeneous cell distributions (a lower CE) can use smaller counting frames and larger grid sizes; ROIs with clustered cells may need larger counting frames and smaller grid sizes.
Procedure
- Run the Fractionator probe as you normally would to count all objects within your ROI.
- Optional If you are interested in object size (diameter, cross sectional-area, or volume), you can also run the Nucleator probe.
Because isotropic sectioning is not practical on mono-layer tissue, you will always view your cells from the same orientation. If your cells are perfectly round, this is not a problem, but elongated cells (such as rods or cones) will introduce bias into your size measurements.
- Once you've completed the Fractionator run, go to Probes>Probe Run List, select your Fractionator probe then click View Results.
- In the Sampling Results window, click Counts By Site to view the number of cells counted at each site.
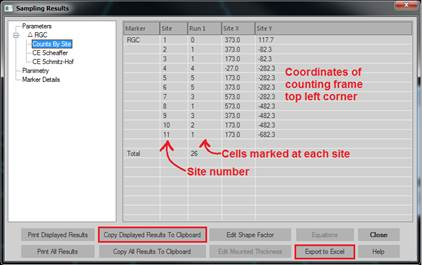
The Site X and Site Y numbers refer to the upper left corner of the counting frame. These are in microns, relative to the reference point.
If the coordinates are not displayed, adjust your preferences. Go to File > Preferences > Stereology > Results, and check the box to Display fractionator site details. - Use the results:
- If these data are all you need (for example, generating a xyz.csv file for use with Retina), click Copy Displayed Results To Clipboard an paste the results into another application.
- For more details, use Export to Excel. In the Excel file, you'll see worksheets (tabs) that are of special interest for a project like this:
- Marker Details: Information on each individual marker.
Run: The first probe run will be 1, the second 2, etc.
Site Number: Indicates the site in which the marker was placed. The first site will be site 0.
Site X/Site Y: Coordinates of the top left corner of the site, in microns, away from the reference point.
Marker Name: To change marker names, right-click markers in the marker toolbar (in Stereo Investigator) to rename them.
Marker X/Marker Y: Coordinates for each individual marker, in microns, away from the reference point.
Marker Z: Typically, this will not be used since you are sampling mono-layers of cells. However, if you meet these three conditions:
- You are working with a high numerical aperture objective (such as 100x/1.3),
- At each site, you focus on the top of your tissue, then press Alt+S to set the Z meter to 0,
- You make sure to always mark the exact top of the cell,
then this number will give you the distance from the top of the tissue in microns. Note that this does not take into account shrinkage of your tissue.
Nucleator Ray Length: The mean length of all nucleator rays associated with the cell. You can calculate the cross sectional-area using: cell area = pi * nucleator ray length ^ 2, however due to the non-random orientation of your cells, any bias will also be squared - so you may want to report the raw ray length as-is.
- Counts by Site: Number of cells counted at each site, along with the site X and Y coordinates.
- Raw Report: If you are interested in quantifying multiple types of markers, use this data to obtain the number of each different marker type at each site.
- Graph your data in R, Python, MATLAB, or a similar application. A number of options are available, and different labs use different approaches to generate their topographic maps.
Exporting your contour coordinates
- Before delineating your Fractionator ROI, click the gear icon to access Contour Preferences.
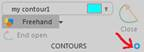 Double-click a contour name to rename it; change the name to something unique (such as "retina"). If you've already traced a contour, click Select Objects, click your ROI contour to select it, right-click and select Change Contour Type.
 - Save your data file using File>Save As>Data File. Select ASC as the file format.
- Open your data file in Notepad.
- Search for the unique contour name you entered (e.g., retina).
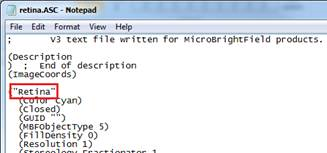
- Scroll down to see a list of coordinates below the "contour name" section.
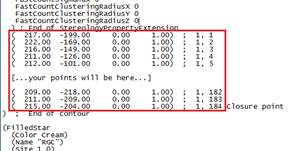
- Copy these coordinates and paste them into Excel. In the Paste Options, select Use Text Import Wizard.
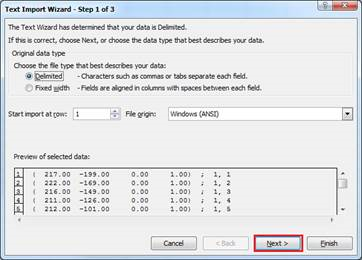
- Click Next.
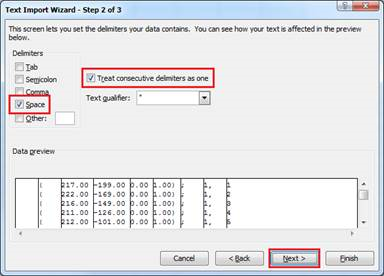
- Select Space as a delimiter, and check Treat consecutive delimiters as one. Click Next, then Finish.
- Hold the Ctrl key and select columns A, B. Right-click and select Delete . Repeat to remove the right 5 columns.
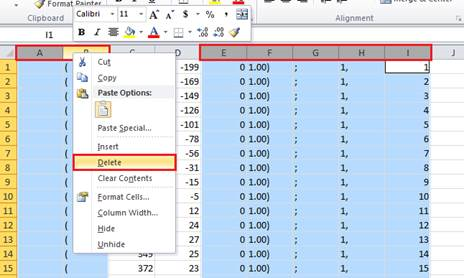
- Column A now contains all X coordinates for the contour, and column B has all Y coordinates. You can save these as a CSV or other file from Excel.