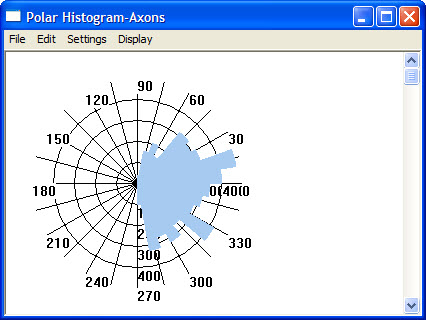
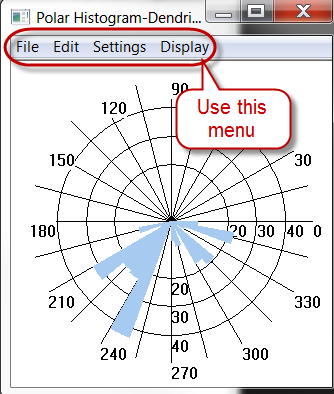
|
Direction |
The polar histogram describes the overall direction of dendritic growth.
|
The meaning of length in polar histograms is important: Projection
collapses Z, but length in Z is used in the length calculation for the
polar histogram. The total length in the polar histogram is the same as
the total length of all processes used in the polar histogram analysis.
The polar histogram is not affected by translation. If several processes are included in the analysis, then the relative position of the processes is unimportant.
Use to avoid the disconnection problem associated with the traditional histogram (i.e., the right side of the histogram is connected to the left side) and to make the information easier to interpret visually.
Perform for dendrites, axons, and apical dendrites.
Apply to the results of the Fan In transform by checking the Apply Fan-in Transform checkbox.
While it is generated, a polar histogram breaks each segment of a tree into a series of straight line segments.
The 3D tracing is reduced to a 2D polar histogram, that is, the spatial geometry is transformed into length and direction. The polar histogram considers direction to be a local property of the process (while the wedge analysis describes direction relative to a fixed point for all of the dendritic processes).
The right side of a circle has a tangent that runs vertically.
Throughout this circumnavigation of the circle, all directions are equally represented. A polar histogram of a circle is a solid circle around the center of the graph.
Although projection collapses Z, length in Z is used in the length calculation for the polar histogram. The total length in the polar histogram is the same as the total length of all processes used in the polar histogram analysis.
Analysis can be performed for dendrites, axons, and apical dendrites. The polar histogram can also be applied to the results of the Fan-In transform by checking the Apply Fan-in Transform box.
The instructions below refer to the Polar Histogram menu (not the general Neurolucida Explorer menu).
The discrete coordinates of the computer are similar to a checkerboard.
The example illustrates the difference that cubic spline smoothing makes in the analysis
of the data.
This tracing was analyzed without (left) and with (right) cubic spline smoothing.
Radial Length—Adds or removes radial length markers from the display.
Degree Ticks—Adds or removes degree ticks from the display.
Outline Pie Segments—Adds or remove a black outline around the pie segments.
McMullen, N.T., Glaser, E.M., and Tagamets, M (1984). Morphometry of spine-free nonpyramidal neurons in rabbit auditory cortex. Journal of Comparative Neurology 222:383-395.
Neurolucida Explorer 11 | MBF Science Support Center | Downloads