Punctum analyses
These reports can be used to evaluate puncta detected in the 3D environment using the Puncta tool in Neurolucida 360 software, version 2020.2.1 and later.

|
Punctum analyses are included in the Region Data section of the Analyze tab. |
Summary
Punctum summary
Reports a summary of the puncta selected for analysis. Puncta are grouped by the color channel in which they were identified. The report includes the color channel, number of puncta selected for analysis, their average volume, and their average surface area.
Punctum details
Reports information about each punctum selected for analysis. Puncta are grouped by the color channel in which they were identified. The report includes the color channel, the average surface area of the puncta selected for analysis, their average volumes, location coordinates in X, Y, and Z, and maximum and minimum cross-sectional areas.
Colocalization
Colocalization Analysis
The analysis reports the number of selected puncta in each color-channel that overlap with selected puncta, and/or spines, and/or somas in a different channel.
-
If needed, adjust the value specified in the Overlap percent to colocalize box.
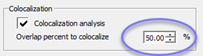
- Puncta and spines are considered colocalized if their percent overlap is greater than or equal to the value specified.
Distance
Distance from additional structure
Report shows the minimum, average, and maximum distances between selected puncta centroids and other selected structures. If there are puncta that were detected in more than one color-channel, distances are reported on puncta in each color channel.
Nearest neighbor
Nearest-neighbor analyses evaluate absolute and relative positions of selected puncta centroids in each color channel in relation to other selected puncta.
Puncta Nearest Neighbor - Summary
The summary report lists the number of puncta selected in each color channel and the closest, average, and farthest distance between any two of the selected punctum in the same channel. Distances are calculated from puncta centroids.
Puncta Nearest Neighbor - Details
The details report shows the location coordinates of each selected punctum centroid and its closest punctum in the same color channel. The distance between the centroids of these nearest neighbors is also shown.
Puncta Nearest Neighbor - multi-channel
The multi-channel report lists the closest, average, and farthest distance between any selected punctum in one color channel to any selected punctum in other color channels. Distances are calculated from puncta centroids.
Distance along branch
Distance from the start of the branch to the point on the branch closest to the punctum.
Marker to branch
Distance from the marker to the closest point along the dendritic segment.
Distance from root
Distance from the origin of the tree, along the tree, to the point closest to the marker.
Distance to previous
Distance along the tree to the previous marker. If the marker is not placed on the tree, Neurolucida Explorer provides the distance to the point on the tree that the marker is associated with, instead of the distance to the marker.
Contours
Puncta in closed contours
Selected puncta and contours are projected into a single X-Y plane and a summary of the number of puncta in each color channel contained within the bounds of the contours is reported. Z-plane information is not taken into account in this analysis.
Puncta to contour distance
Average distance from the centroids of selected puncta within a color channel to selected contours.
Puncta along contour distance
The distance of selected puncta in each color channel to the selected closed contours in the tracing. The distance reported is the shortest distance from a punctum to the nearest contour.
Puncta to surface distance
Provides the average distance of selected puncta in each color channel to a surface generated by Neurolucida Explorer software from two or more open contours (open delineations). The distance reported is the shortest distance from a punctum to the nearest point on the surface.
Closed surface
Puncta in closed surface
This analysis provides information about selected puncta located inside a 3D shape generated by adding a skin to closed contours that are aligned in the Z direction. Confused? See an image that represents closed surface analysis for an axon.
Puncta in closed surface
Simple report of the surface name and total number of puncta in each channel in the surface
Punctum in surface details
Provides information on each punctum selected for the analysis, including the surface being analyzed, punctum color-channel, surface area, volume, and location coordinates.
Layers
Puncta in layers
Reports the number and collective volume of selected puncta in each channel that are positioned between two or more open contours in the XY orientation without considering the Z-plane.
Density
All density reports take into account the user-defined maximum distance between puncta and spines or trees.
Puncta-Spine Density
Reports the density of puncta surrounding individual spines.
Puncta-Spine Density by Segment
Provides a breakdown of puncta density surrounding individual spines by branch segment.
Puncta-Tree Density
Reports the density of puncta surrounding individual trees.
Puncta-Tree Density by Segment
Provides a breakdown of puncta density surrounding individual tree segments.