Fan In diagram
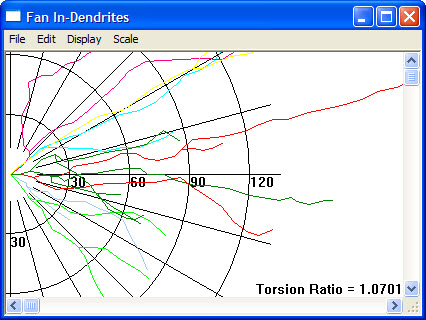
Use the Fan In Diagram to understand any preferred orientation in the dendritic processes and to eliminate many of the distortions related to depth foreshortening.
The Fan In diagram can be combined with the Polar Histogram to investigate any preferential orientation of the processes. The Polar Histogram of the fan in diagram reduces the visual image of the Fan In diagram into values that describe the amount of growth in a particular direction.
 Select Fan in diagram from the orientation drop-down menu on the Analyze ribbon. Neurolucida Explorer opens the Fan In Analysis window.
Loss & distortion / the torsion ratio
Torsion ratio = (Length of processes) / (Length of the processes after applying the fan in projection)
The Fan In Diagram displays the dendritic processes with some loss in length. The length is lost when the three-dimensional model is ‘fanned’ into two dimensions. The amount of loss is described by the tortuosity factor, or torsion ratio.
- A value of 1 is the smallest possible torsion ratio and means that there is no loss in length.
- A value of 2 means that the fan-in projection reduced the length of the processes by a factor of 2.
- Torsion ratio values are usually closer to 1.
How it works
The Fan In diagram begins by placing an axis through the neuron. The axis is always a vertical line.
Imagine attaching one edge of a sheet of paper to the axis. The sheet of paper is swept around the axis collecting tracings of the dendritic structures. After sweeping through a full 360 degrees the sheet has collected all of the dendritic structures that have been traced with all of the dendritic processes appearing on the same side of the axis.
Reference
Glaser, E.M., McMullen, N.T. (1984). The fan-in projection method for analyzing dendrite and axon systems. Journal of Neuroscience Methods, 12: 37-42.