Group analyses
Use the group analyses to compare data from files that have already been processed (i.e., tracking has been performed). You can compare individual files and aggregate data (i.e., data from grouped files).
Procedure
- Perform tracking for the desired files using Batch processing.
- Click
 (or select View>Group analysis) to display the Group Analysis & Plotting panel.
 - Select project files:
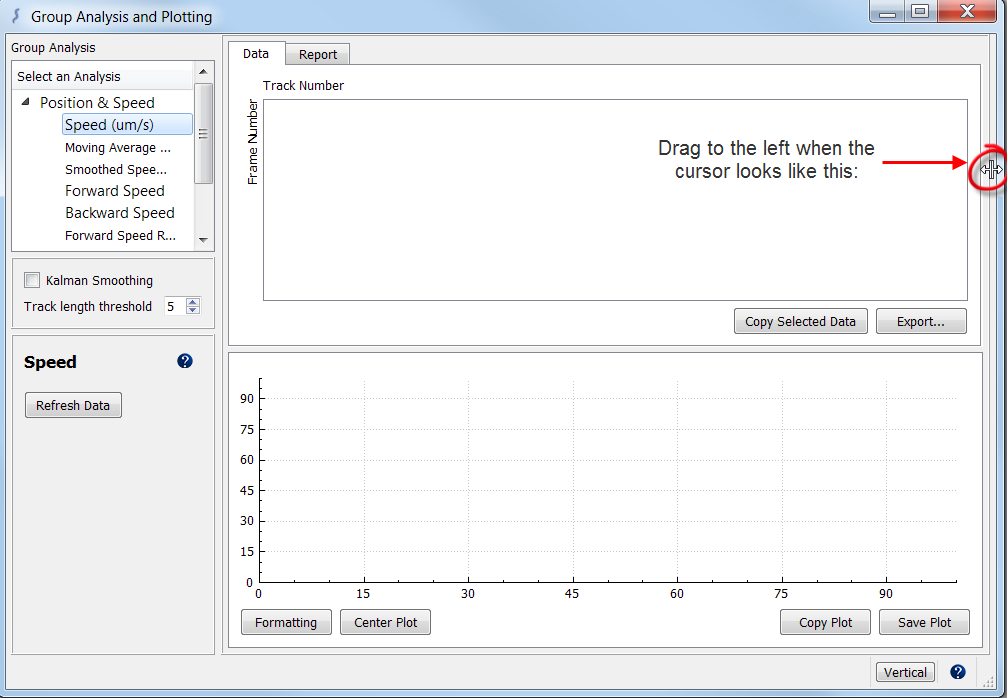
- If you can't see the options to add files: Place your cursor to the right of the panel so that your cursor changes to a double arrow
 then drag left to display the options.
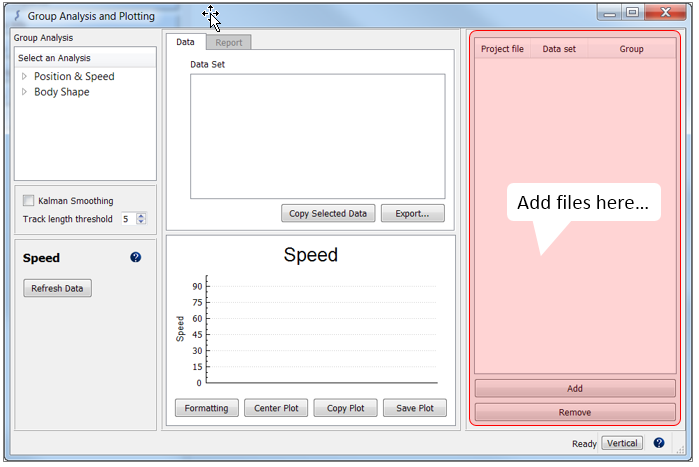
- Click the Add button and select project files.
By default, each data set is named after the file name. To change the data set name, double-click the name and type a new name.
- If you can't see the options to add files: Place your cursor to the right of the panel so that your cursor changes to a double arrow
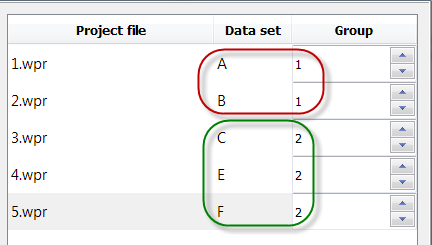
- By default, all the files are associated with Group 1, which means that data for each file is displayed separately. To display results from aggregate data, create additional groups:
- Under Group, change the group number associated with a project file as needed; data associated with the same group number is aggregated.
- Click Refresh data on the left.
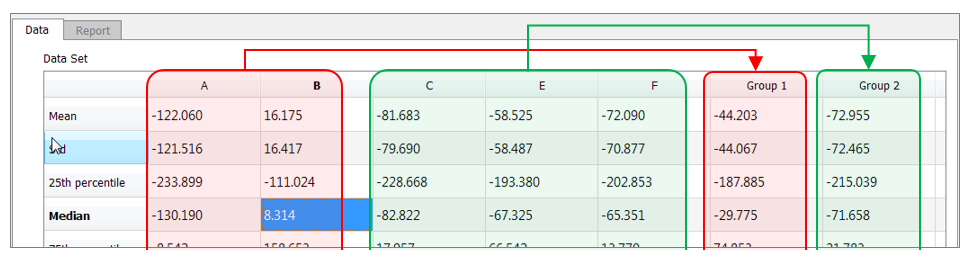
In the example, data from A and B is aggregated in Group 1, and data from C, D and E is aggregated in Group 2.