Proximity
Use to analyze the distance between two trees (e.g., distance between a neuronal fiber and a blood vessel).
Neurolucida Explorer compares the trees and determines the percentage of the fiber in closest proximity to the neighboring fiber.
Procedure
- Select both trees in the Data List window by clicking their labels.
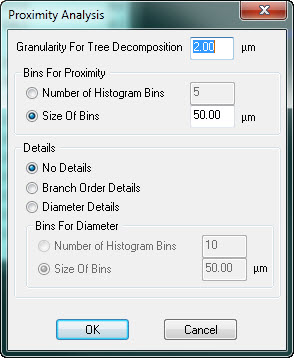
- Click Analyze>Neuron data>Anatomical and open the Proximity Analysis window opens
 .
.- Granularity for Tree Decomposition: Distance between points on each individual fiber.
Ex: Setting the granularity at 2 for a 10-µm fiber results in 5 points on the fiber.
- Bins for Diameter: Available if you selected Diameter Details.
Analysis results
Tree: Neurolucida Explorerassigns number 1 and number 2 to the trees of interest.
Bin Start and Bin End: Shortest distance bin between the points.
Length: Length of the tree within the range of the shortest distances.
Percent Length: Percentage of the tree length that is within the distances specified in Bin Start and Bin End.
Order: If you selected Branch Order, values are broken down by order.
Reference
Bearden, S.E., and Segal, S.S. (2005). Neurovascular alignment in adult mouse skeletal muscles. Microcirculation. Mar 12(2):161-1677.