Detect Varicosities Panel (3D)
Detecting & editing varicosities (3D)
Detection
Only available when trees have been traced.
Varicosities are modeled using five points along the centerline of a process. 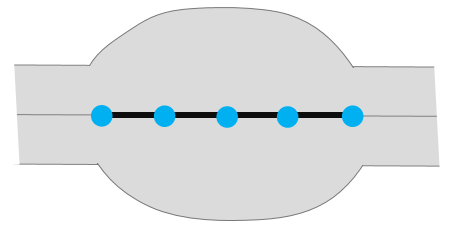
Varicosities placed manually in 2D are represented by 2D markers in the 3D window.
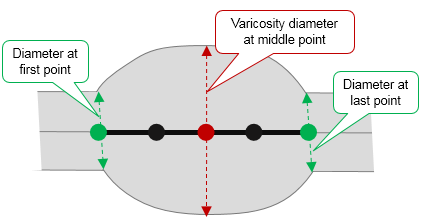
Ratio: [Varicosity diameter at middle point] / [Underlying branch thickness]
Branch thickness = {diameter at first point + diameter at last point] / 2
To improve detection along thin processes, the thickness metric is calculated at each of the five points as [Measured diameter] * [Image brightness diameter's center].
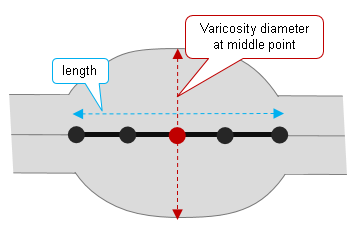
Ratio: [Varicosity length] / [Diameter at varicosity middle point]
Varicosities are modeled using five points along the centerline of a process.
Varicosity length is the distance between the first point and the last point.
Used by the detector during image segmentation. Higher percent values result in image appearing brighter to the detector.
Check this box if:
- You placed varicosities manually prior to using Detect All.
- You used Detect all then decided to use different settings to detect more varicosities while keeping the varicosities already detected.
- You notice that, when you click a varicosities to detect it, the model of a varicosities adjacent to it is removed. This may happen in the case of colliding varicosities . Keep existing varicosities prevents the colliding new varicosity from removing the existing one.
Automatically detects varicosities based on the default settings defined in Detection.
Detection is restricted to the varicosities whose center is located at least one radius away from the start or the end of a branch. We use the varicosity's middle point radius. 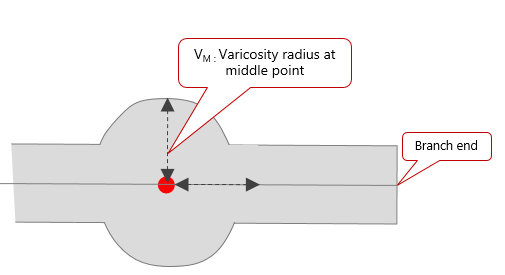
This option enables you to restrict the automatic detection to a single branch instead of the entire image.
- Adjust the detection settings under Detection.
- Check the box.
- Click near the desired branch.
Options
Pan to window center after each click
Use to avoid panning manually while tracing. The last point clicked is automatically re-positioned at the window center.
How are varicosities detected?
Once you've clicked the Detect All button or clicked individual varicosities to detect them, the program takes a series of steps.
- For each traced branch, the program performs a 2D Rayburst sample at consecutive (and closely-spaced) points along its centerline to estimate the Rayburst diameter at each point.
- At each point, a thickness metric is computed: [Rayburst diameter] * [Image intensity].
- The program analyzes the metrics obtained to determine the location of potential varicosities and their boundaries (i.e., start and end location) along the branch centerline.
- Only the objects that meet the detection criteria are modeled as varicosities. They can be rendered as either a sphere or as a 5-point tubular segment.