Neurons in the Basal Forebrain are Exquisitely Organized
The loss of cholinergic neurons is one of the earliest pathological events of Alzheimer’s disease. Cholinergic neurons in the basal forebrain supply the cerebral cortex with acetylcholine, an important neurotransmitter that plays a role in learning, memory, and attention. Details about the function and organization of basal forebrain (BF) neurons are not well understood, but Dr. Laszlo Zaborszky has recently uncovered new information about the structure of this complex area of the brain.
In a paper published in Cerebral Cortex, Dr. Zaborszky and his team report that they discovered exquisite organization in the basal forebrain of rats; the extent of overlap between basal forebrain neuronal populations correlates with the connectivity strength between their cortical targets. This means that basal forebrain neurons that overlap extensively project to frontal and posterior cortical areas that are strongly connected. Connectivity strength between cortical areas is defined by the number of neurons in a defined posterior cortical area that project to a defined area in the frontal cortex.
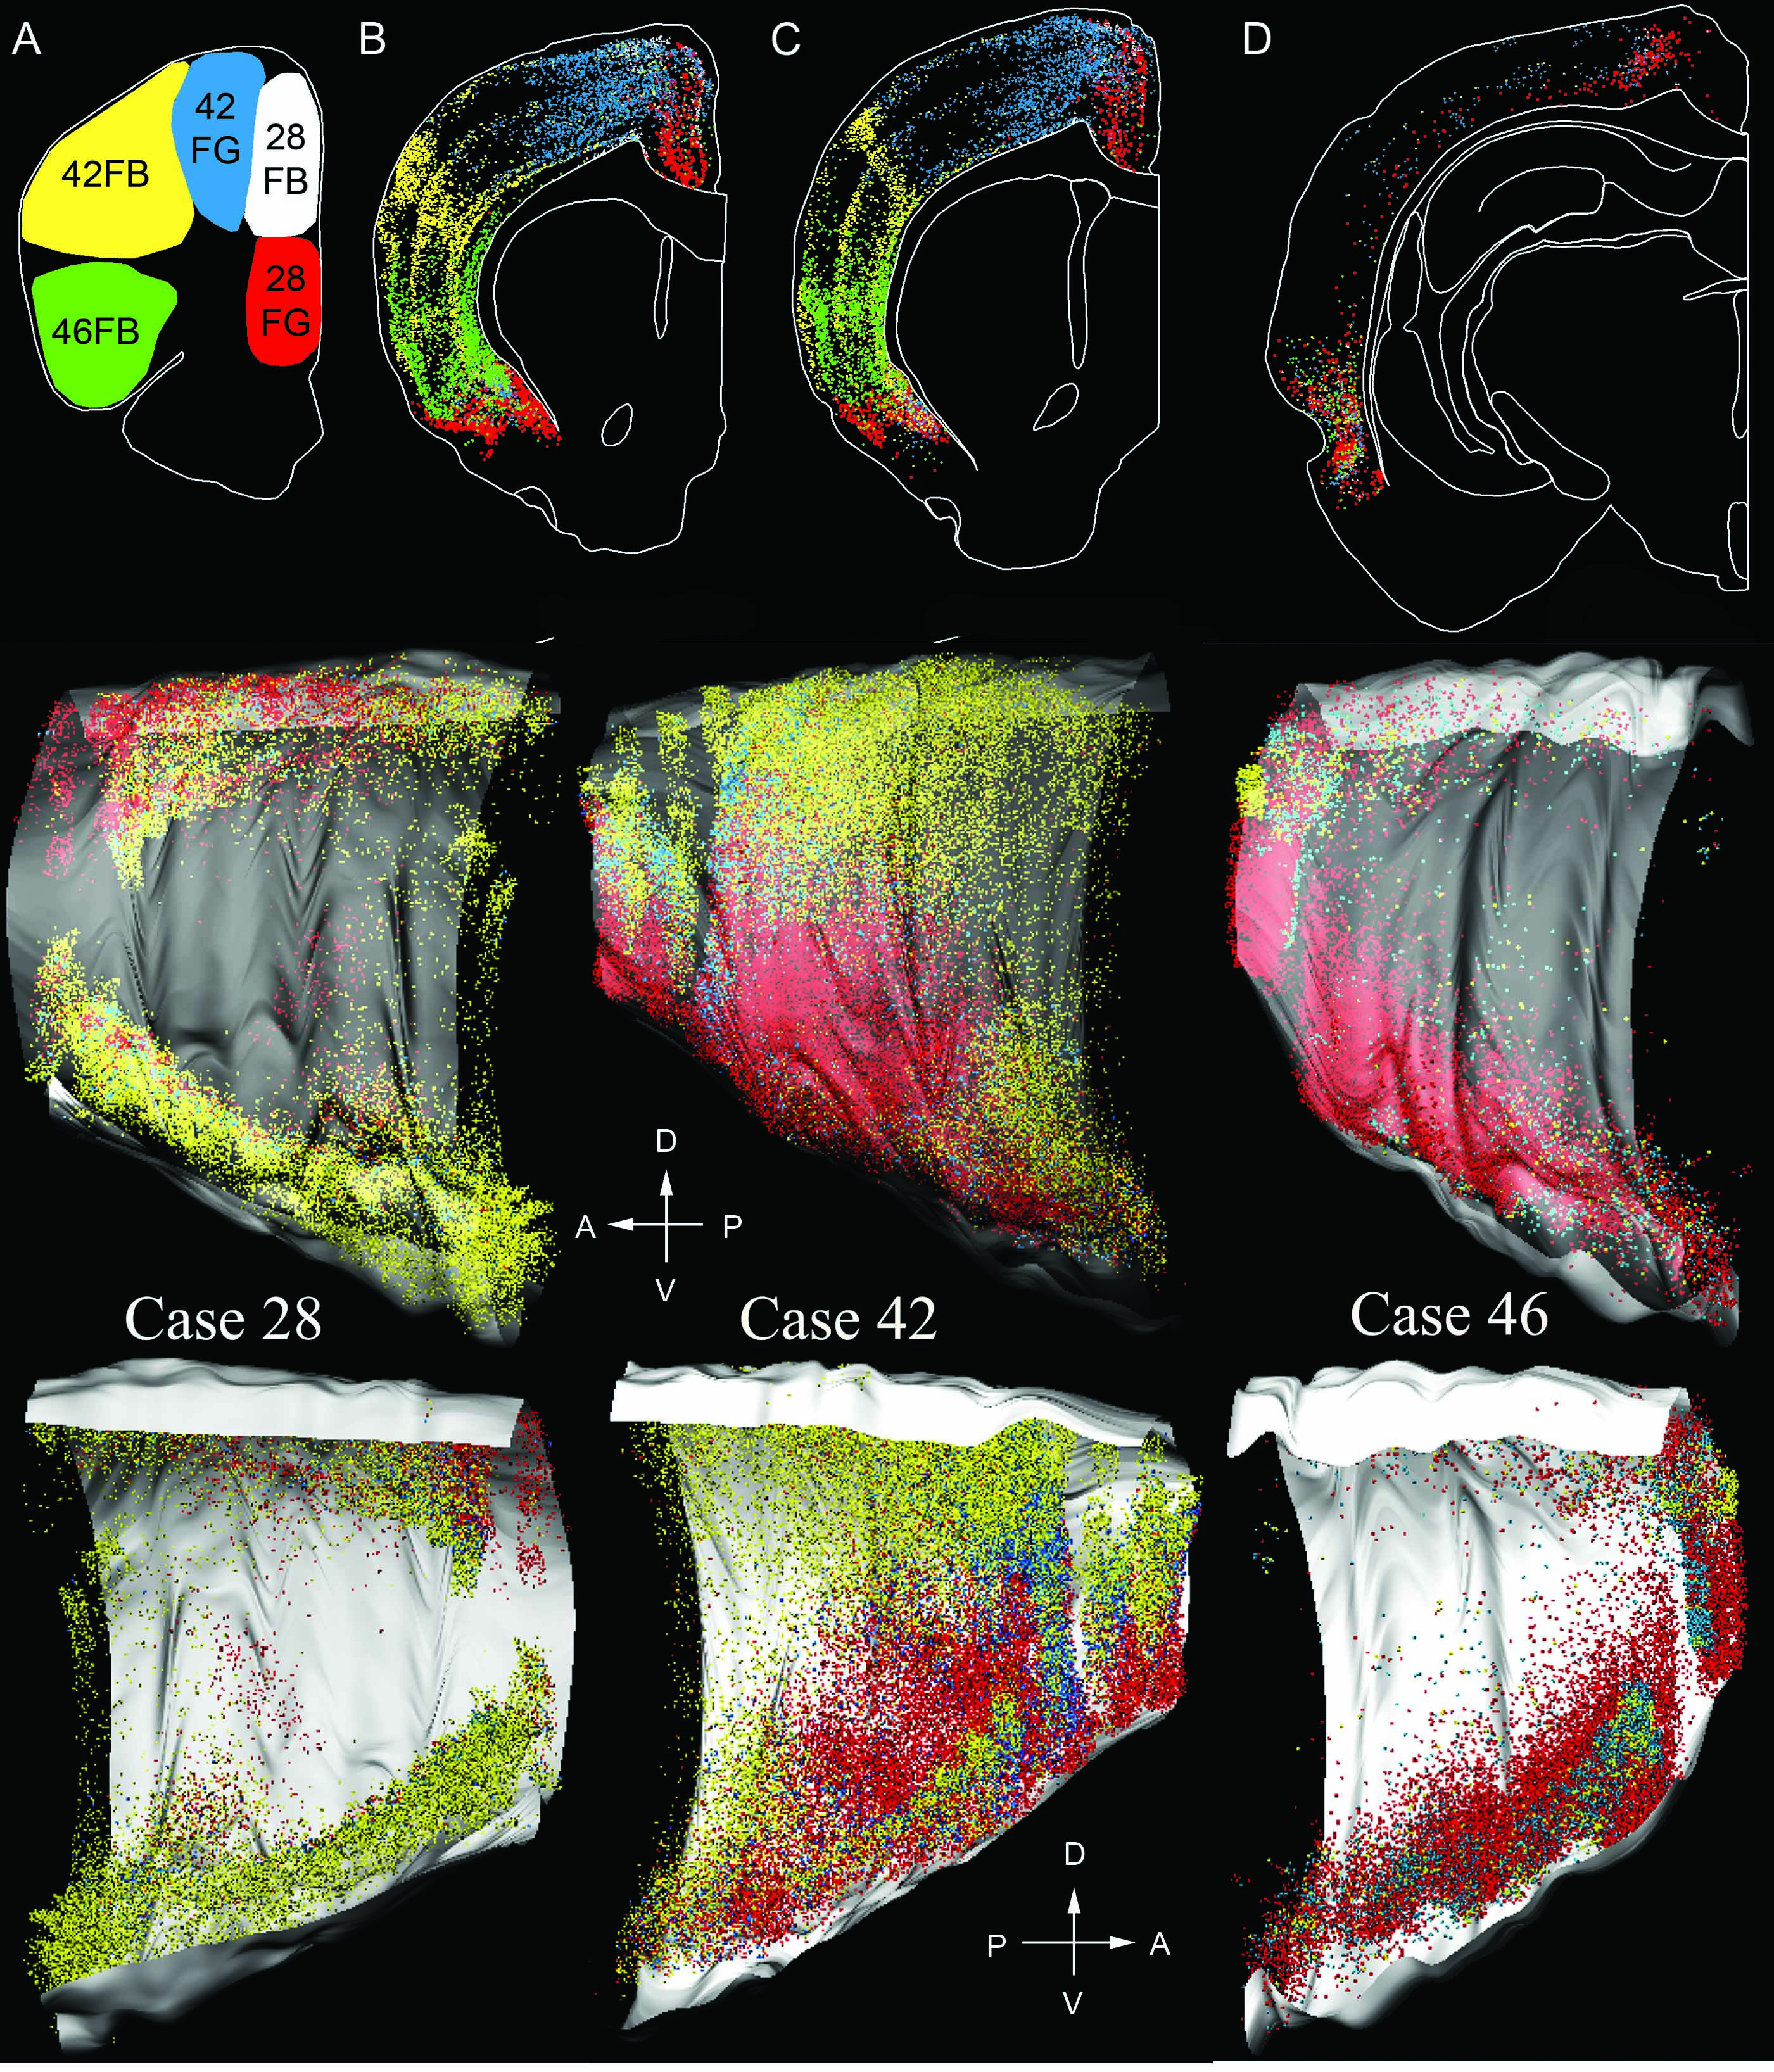
A 3D rendering of the distribution of retrogradely labeled cells in the cortex which project to five different areas in the frontal cortex (experimental group 2). When retrograde tracers are injected into specific anatomical locations in the frontal cortex (A), the organization of cells in posterior cortical areas that project to the frontal cortex becomes apparent (B-D). By integrating across multiple sections, the cell distribution has both rostro-caudal and medial-lateral organization. The top row illustrates the cell locations in 2D, the middle row shows the region in 3D, looking from the outside in (lateral -> medial), and the third row depicts the region in 3D, viewed from the inside out (medial->lateral). This data provided information about cortical connectivity. The degree of overlap of basal forebrain neurons retrogradely labeled from different spots in the cortex depends on the amount of this connectivity.
Image courtesy of Dr. Lazlo Zaborszky
To reach this conclusion, Dr. Zaborszky and his team used Neurolucida to map retrogradely traced neurons in the rat brain. Then, they aligned the reconstructions to correspond with a virtual “master” brain and organized the data into 3 databases for statistical analysis. Zaborszky et al. mined this wealth of data to uncover information about how BF neurons are arranged, including the finding “that cholinergic and noncholinergic projection to the cortex is not diffuse, as was previously thought, but is organized into segregated or overlapping pools of neurons that may transmit information from the basal forebrain to cortical areas that are themselves interconnected.” Thus, it is suggested that overlapping pools of basal forebrain neurons connect to specific cortical areas to influence cognitive processes. With the databases that they were able to create from this experiment, they now have a new set of tools that can be employed for future experiments to model the impact of changing cholinergic signaling (for example, as it does in Alzheimer’s disease) which could then be empirically tested.
For more details about how Dr. Zaborszky conducted this experiment, a summary of the methods section is below:
Two types of retrograde tracers were injected into rats. The first group of rats received 9 injections of Fluoro-Gold (FG) in the frontal cortex, and 9 injections of Fast Blue (FB) in posterior cortical areas that were either at a similar medial-lateral location (coregistered) to the FG injection, or at a different medial-lateral location (non-coregistered). After euthanasia, every eighth brain slice was stained for choline acetyltransferase (ChAT), the enzyme that synthesizes acetylcholine. The second group of rats received 6 adjacent injections of FG and FB (3 of each type of tracer) in the frontal cortex only. Staining for ChAT was not done in this group. Injection sites for the second experimental group are noted in the above figure along with neurons in posterior cortical areas that project to the frontal injection sites.
Then, the researchers used Neurolucida to map labelled cholinergic and noncholinergic BF neurons from rats in the first experimental group, and they used Neurolucida to map the labelled basal forebrain neurons and cortical neurons that project to the 5 frontal injection sites from the second experimental group. After the reconstructions were completed, all of the data was virtually aligned to a “master” brain. By merging data from all labeling experiments across animals in the study in a master brain, they were able to create a composite computational model of the complex circuit. They even wrote custom software to further use the data contained within Neurolucida data files to help them visualize this circuitry.
Dr. Zaborszky and his team created 3 databases before statistically analyzing the data. The first database included reconstructions from experimental group 1 which were maps of retrogradely labeled cholinergic and noncholinergic cells in the basal forebrain that project to 9 injection sites in the frontal cortex and 9 sites in the posterior cortex. Information from this group was used to study various populations of overlapping BF neurons and to see which part of the cortex they project to. BF neurons were identified by both their tracer and whether or not they contained acetylcholine. Database 2 included information from experimental group 2 – maps of BF neurons and neurons in posterior cortical areas that project to 5 injection sites in the frontal cortex. This database also included some information from experimental group 1, specifically the BF neurons that project to 9 posterior cortical injection sites. BF projection neurons in this database were identified only by their tracer, FG or FB. This database helped researchers correlate the overlap of BF neurons that project to the 9 posterior injection sites and 5 frontal sites and helped quantify cortical strength between the 9 posterior injection sites that project to the 5 frontal sites. Finally, Database 3 included all information from experimental group 1 as well as some information from experimental group 2 – maps of neurons in the posterior cortex that project to 5 injection sites in the frontal cortex. This database helped to correlate the overlap between BF cholinergic and noncholinergic neurons with the connection strength between the cortical targets. BF neurons were characterized by both their tracer (FG or FB) and whether they contained acetylcholine or not.
The degree of overlap between neuronal populations was estimated by using an algorithm to divide sections into voxels and then counting the number of cells in each voxel. The extent of overlap between two cell populations was “quantified as the percentage of overlapping voxels that contain both population 1 and 2 at or above threshold relative to voxels that contained only population 1 or population 2 at or above threshold.”
Zaborszky, L., Csordas, A., Mosca, K., Kim, J., Gielow, M. R., Vadasz, C., & Nadasdy, Z. (2013). Neurons in the Basal Forebrain Project to the Cortex in a Complex Topographic Organization that Reflects Corticocortical Connectivity Patterns: An Experimental Study Based on Retrograde Tracing and 3D Reconstruction. Cerebral Cortex. doi: 10.1093/cercor/bht210.